IntermediatePremium
HTMLCSSJS

Pulse: analytics dashboard

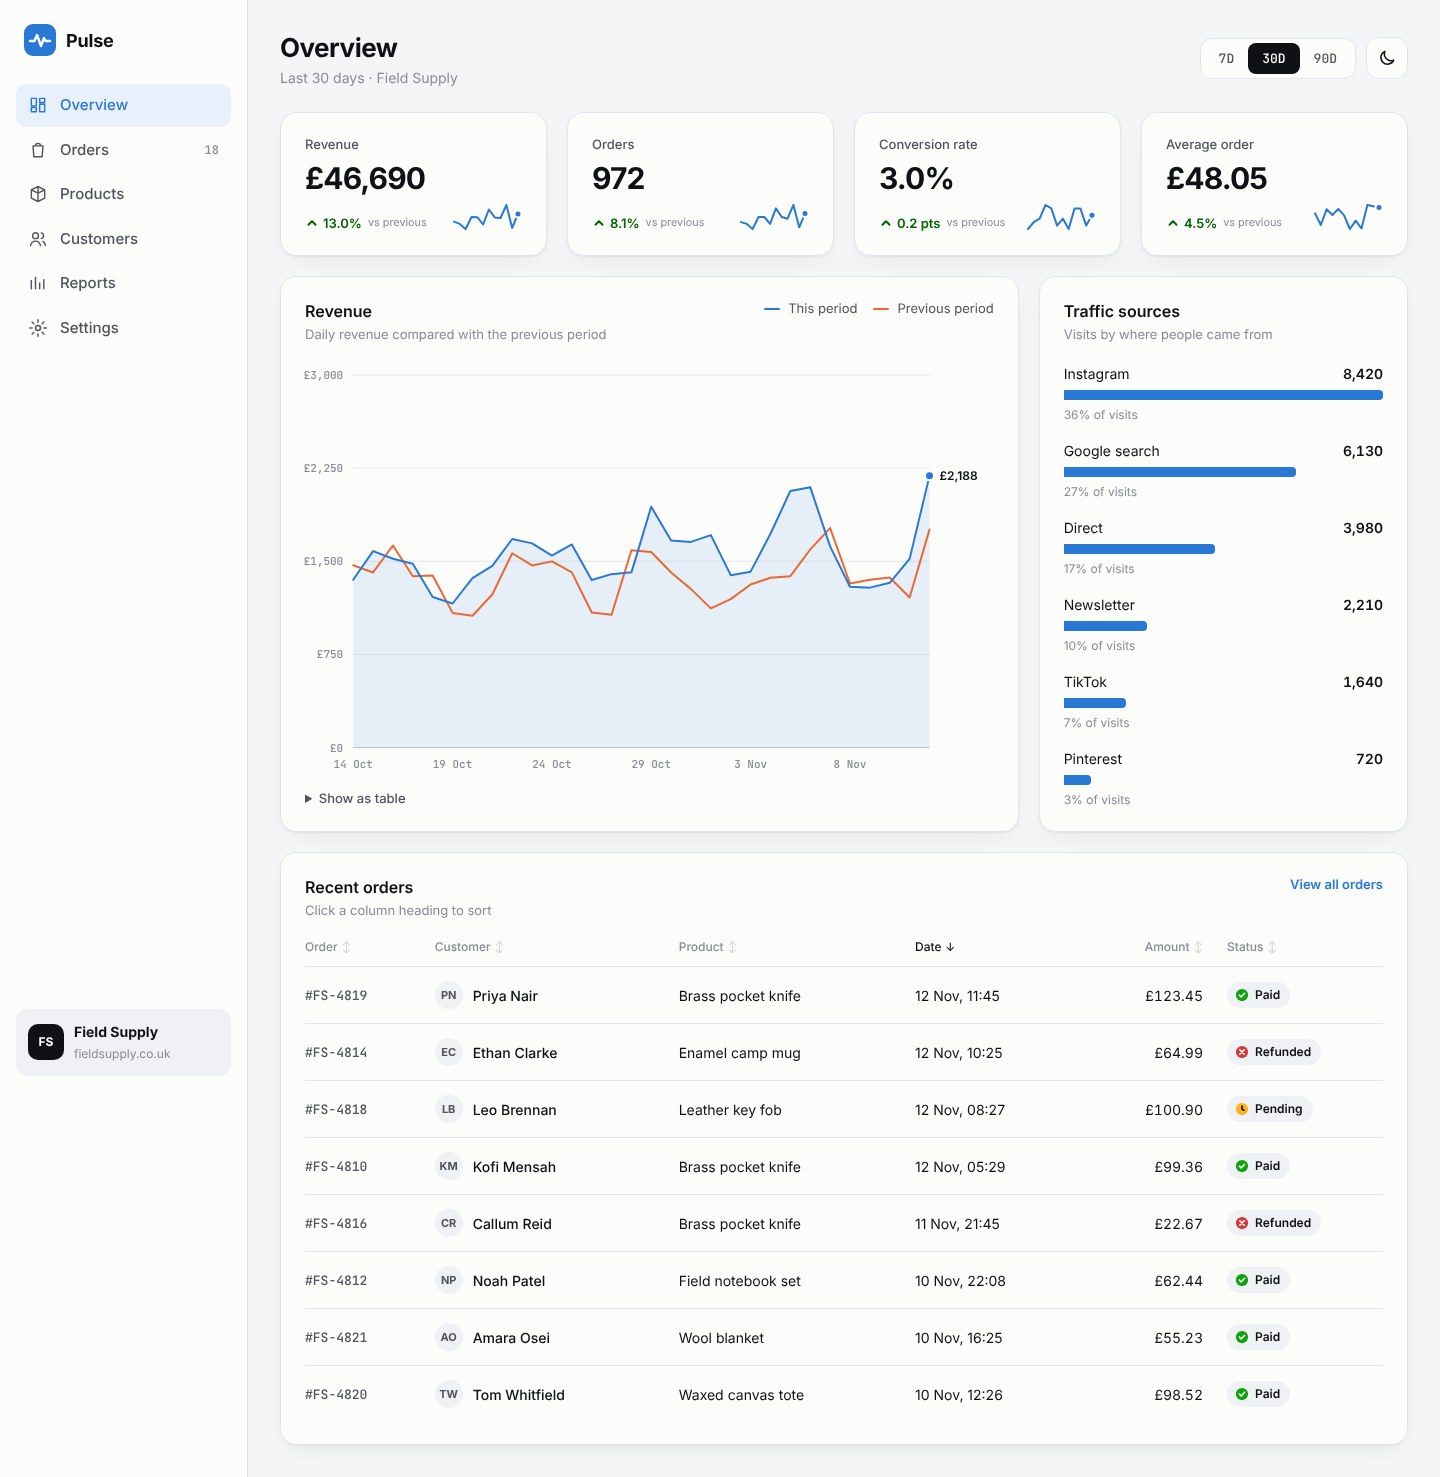
A real app screen: an online shop dashboard with stat cards, a revenue chart, traffic sources and a sortable orders table, all drawn from JSON. With dark mode.

The brief

Your challenge is to build this analytics dashboard and get it as close to the design as you can. This is a real app screen, the kind of work clients pay well for.

Pulse is analytics software for small online shops. This is the Overview screen for Field Supply, an outdoor gear shop. Every number comes from data.json in the starter files. Don't type numbers into your HTML.

What to build

  • Sidebar with the logo, six menu links and the shop at the bottom. On mobile it becomes a slide-out menu behind a menu button.
  • Top bar with the page title, a 7D / 30D / 90D switch and a light/dark mode button
  • 4 stat cards: revenue, orders, conversion rate and average order. Each shows the change against the previous period (up or down, with an arrow) and a small trend line.
  • Revenue chart: a line for this period and a line for the previous period, with a light fill under this period, gridlines and axis labels. Hovering shows a crosshair and a tooltip with that day's numbers.
  • Traffic sources: horizontal bars with the number of visits and the share of the total
  • Recent orders table: click any column heading to sort by it, click again to reverse. Each status has an icon as well as a colour.

Switching the date range updates the stat cards, the chart and the traffic sources.

RulesPart of Pro
You're done when8 checks your build has to pass
BonusPart of Pro

What you get with Pro

  • 6design stillsEvery screen size and scroll scene, at full resolutionπŸ”’
  • 1starter packREADME, content, fonts, libraries and an AI mentor file for your levelπŸ”’
  • 1design fileColours, type, spacing and motion values as tokensπŸ”’
  • 1finished solutionOur production code to compare with yours, once you’ve had a goπŸ”’
  • ∞AI code reviewsScores and line-by-line fixes on every version you submitπŸ”’

Skills you’ll practise

DashboardChartsDark mode
  1. Render every number on the page from data.json, so switching the date range is one function call
  2. Draw the line chart yourself with SVG: work out your x and y scales before you draw anything
  3. Make dark mode its own set of colours, not an inverted copy of light mode

Premium challenge

Build this one with Pro.

Every premium challenge, every file above, and an AI review on every build. From Β£10 a month, cancel anytime.